Game Theory
Creating the best softball team with heatmapping
Don’t be a goofus
I tend to play a fair amount of softball in the summer. For those unfamiliar, it’s essentially the same thing as baseball except its slow
With this in mind, there’s a lot of
Myself, I’m pretty small and fast so when I’m standing around, it’s usually because somebody put me left-center—a popular area for fly balls. And between my sprinting, I began thinking: based on the average flight pattern of a fly ball verse the positioning of our defense, how can we best plan our defense to minimize the amount of sprinting needed (or maximize laziness, if you want to look at it that way)?
That night, I hopped on to Illustrator and made myself a map.
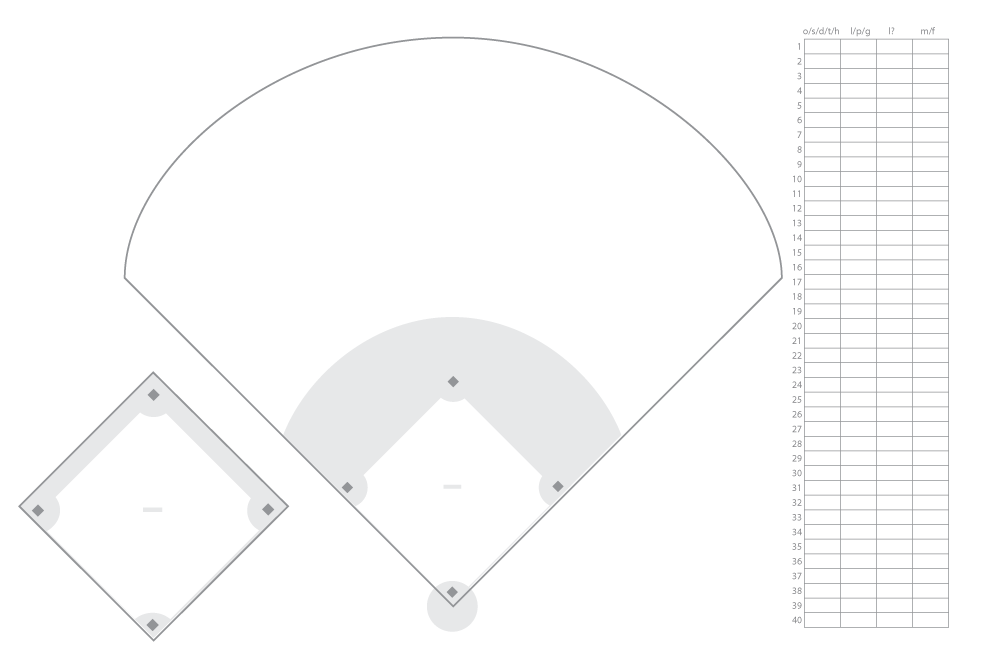
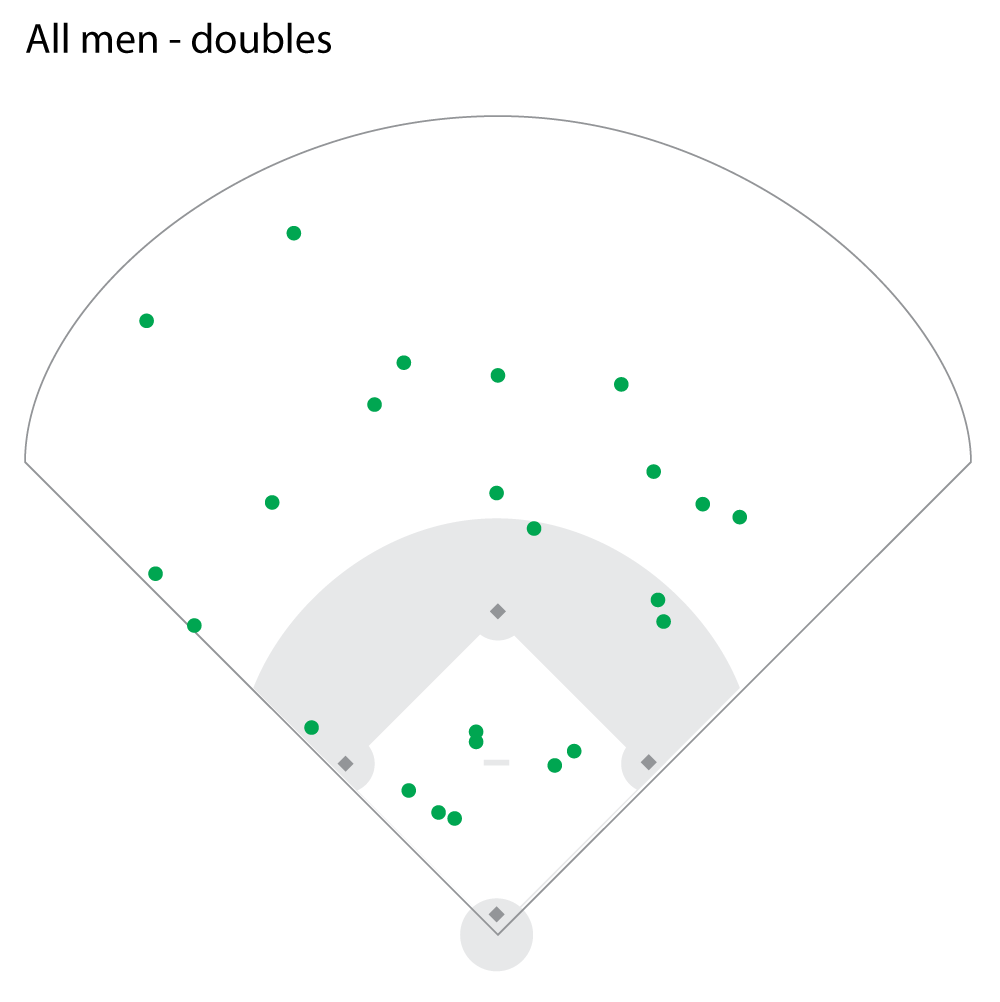
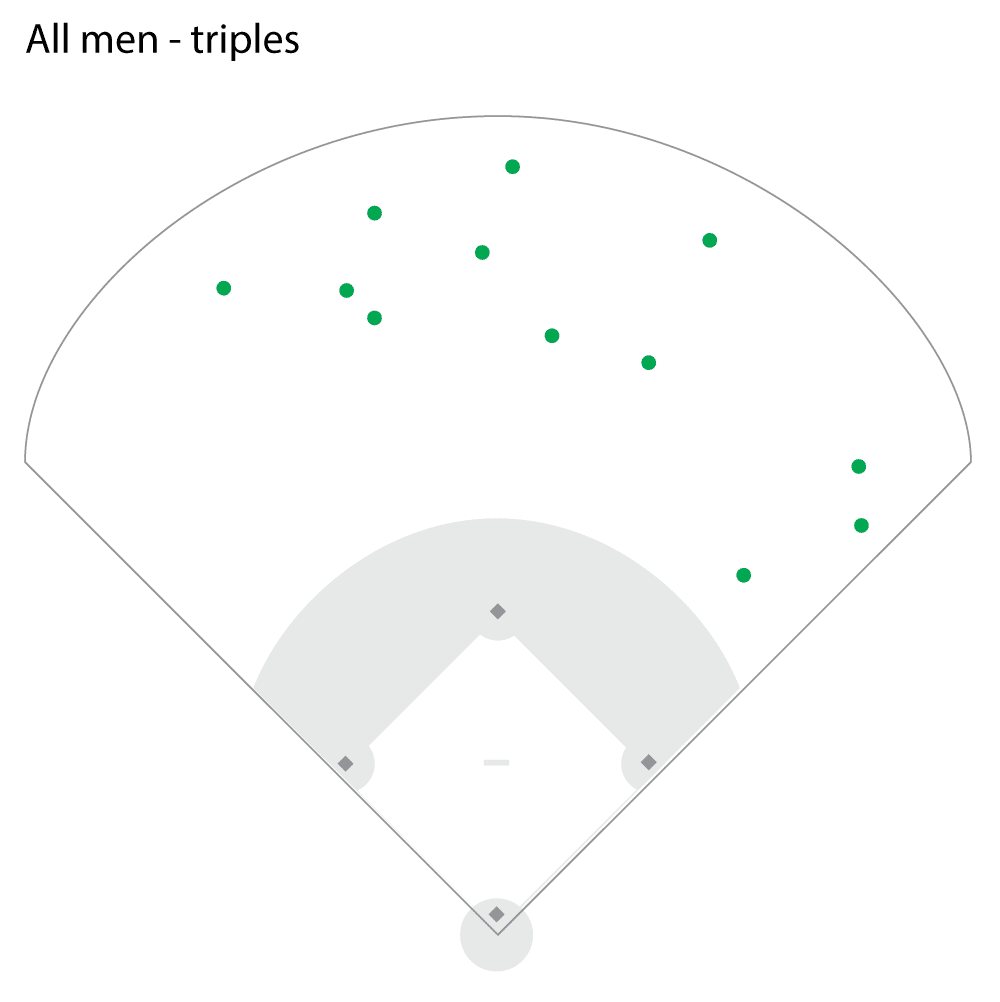
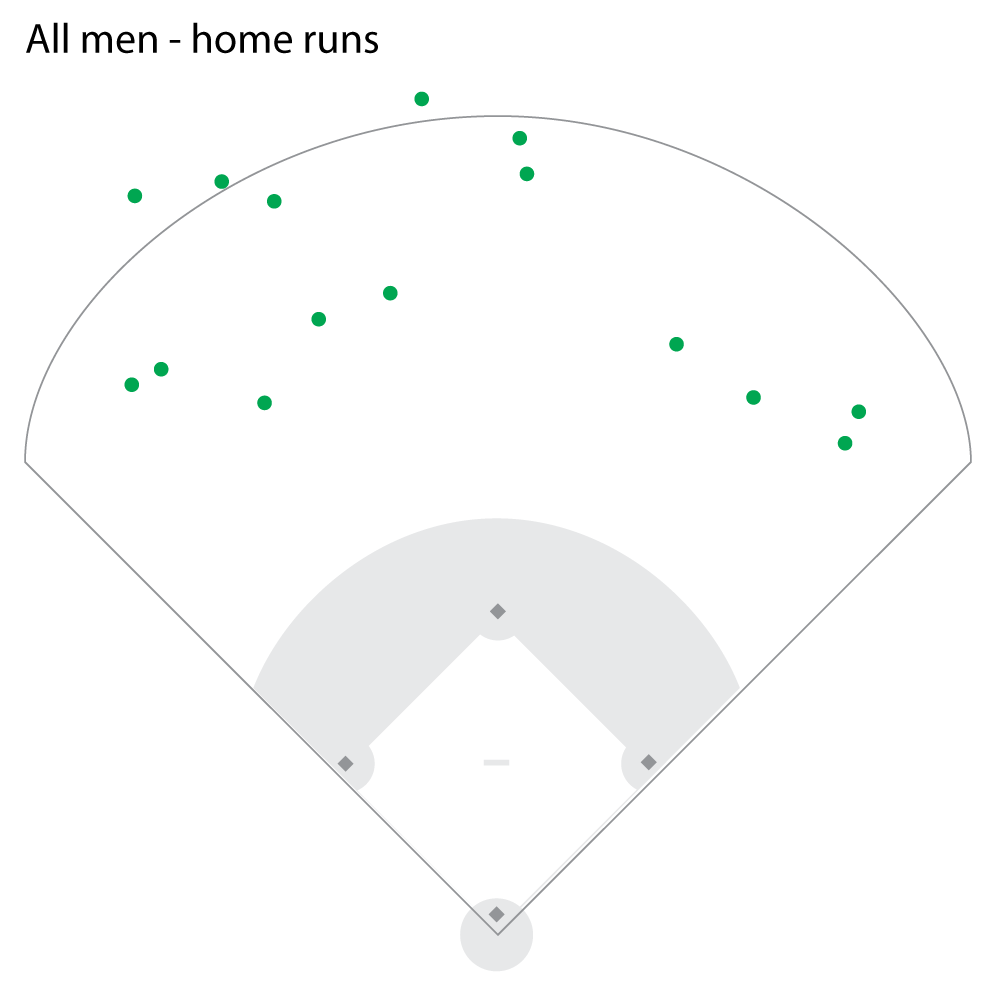
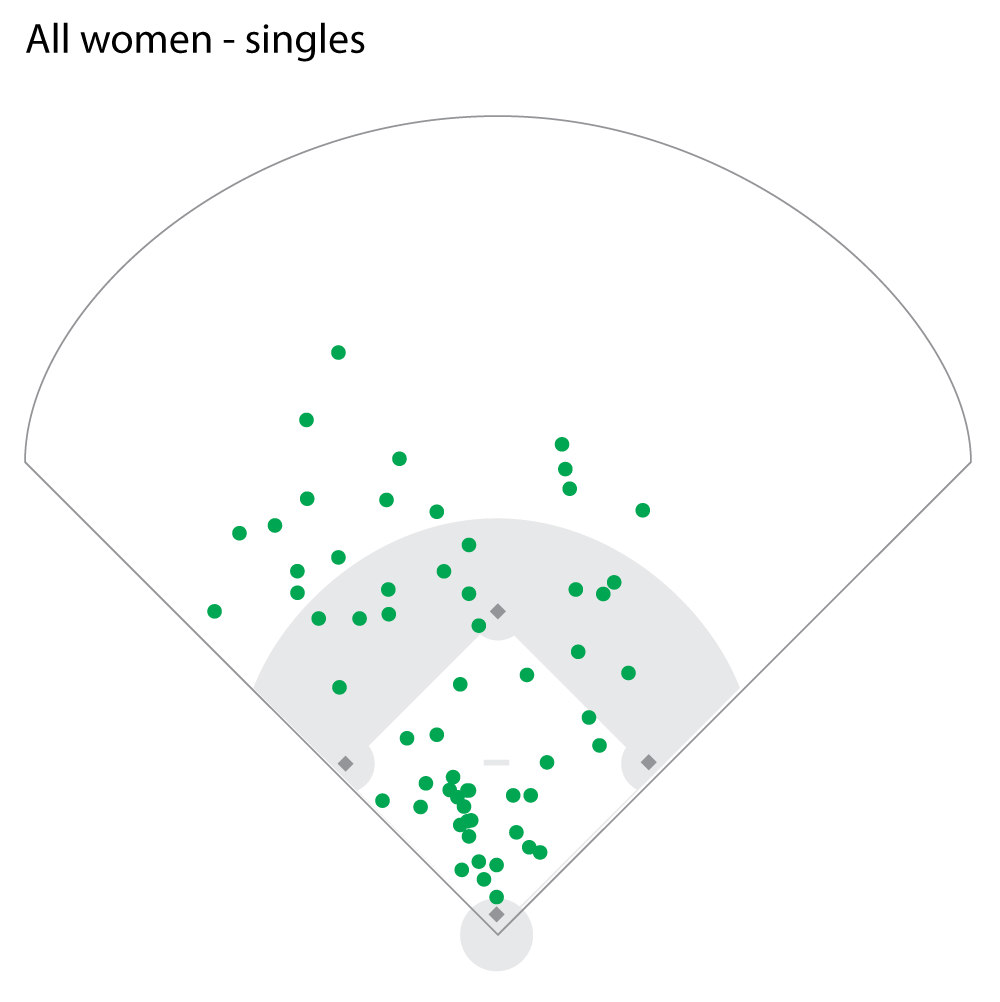
- Where did the ball land?
- Was it a single, double, triple, home run, or out?
- Was the hit a grounder, line drive, or pop fly?
- Was the batter left handed or right handed?
- Was the batter male or female?
I also decided that, if I was tracking the information anyway, I might as well follow the scientific method and propose a hypothesis. And even though my original goal was the determine where outfielders are best placed, there was another question I had that this data could potentially answer. With this in mind, I had two hypothesis ready for validation.
The average position of outflieders shouldn’t be stationary. Depending on the batter, the positions should change.
Fast ground balls are twice as effective as line drives.
My hypotheses were made! All that was left was to collect and interpret the data.
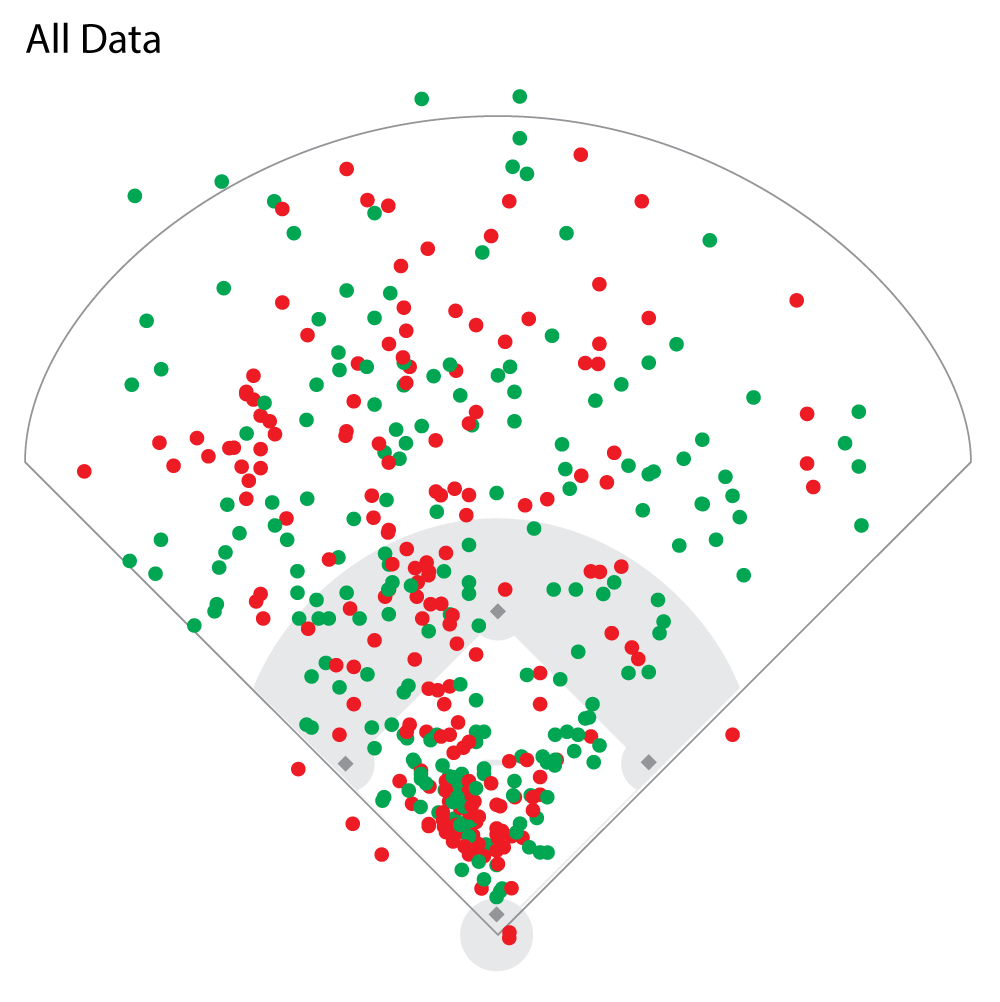
The data
- Total hits = 406
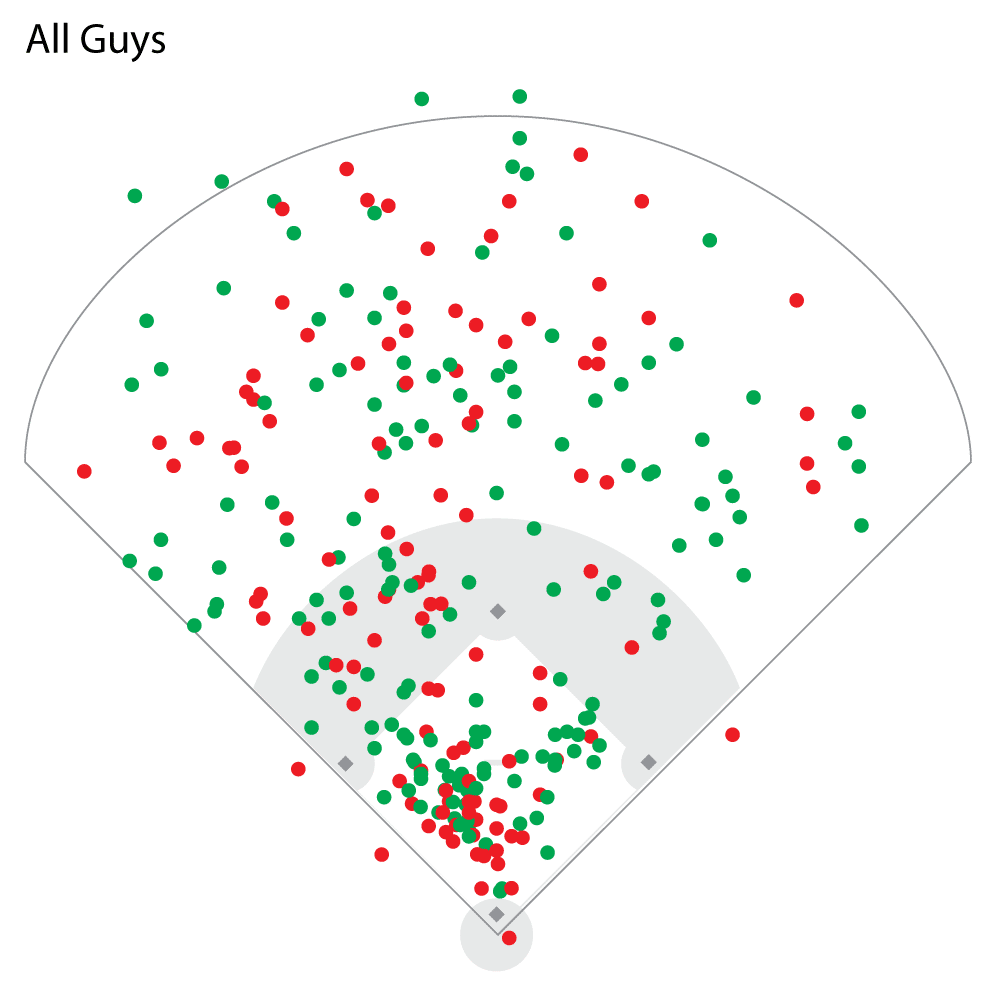
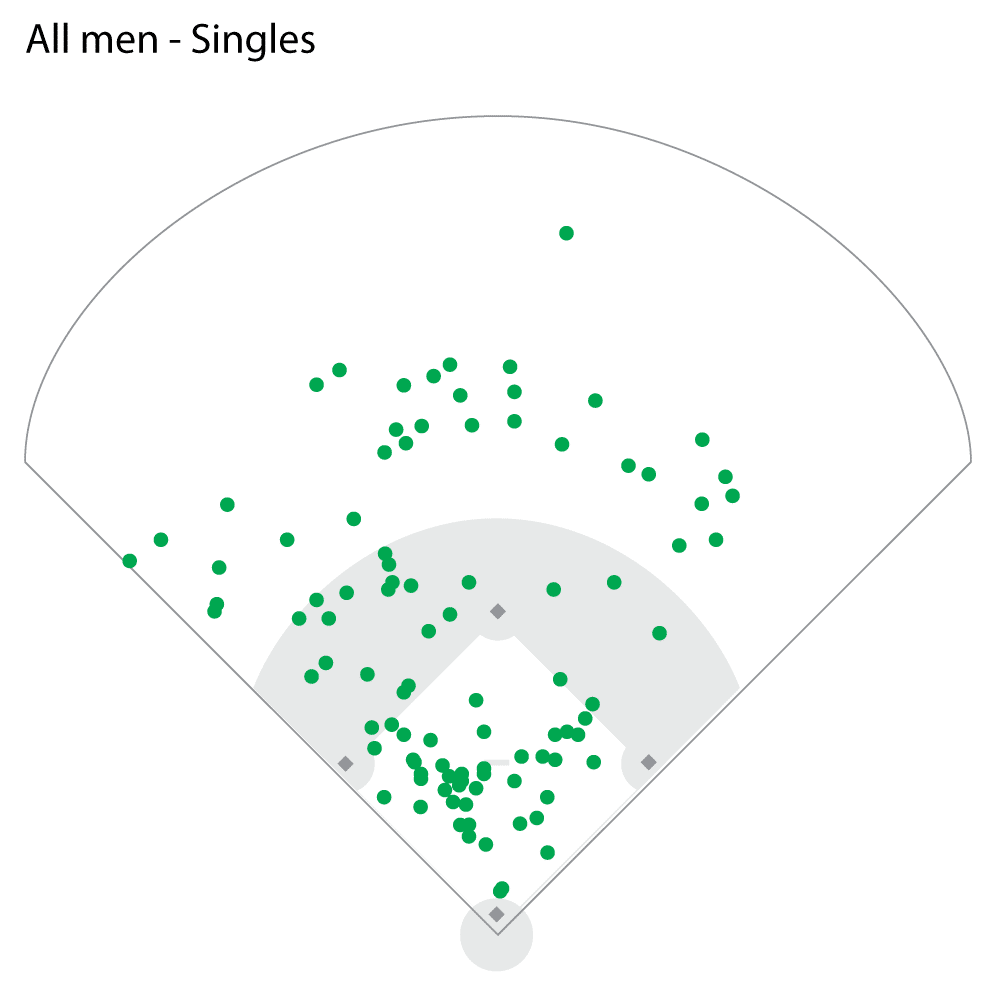
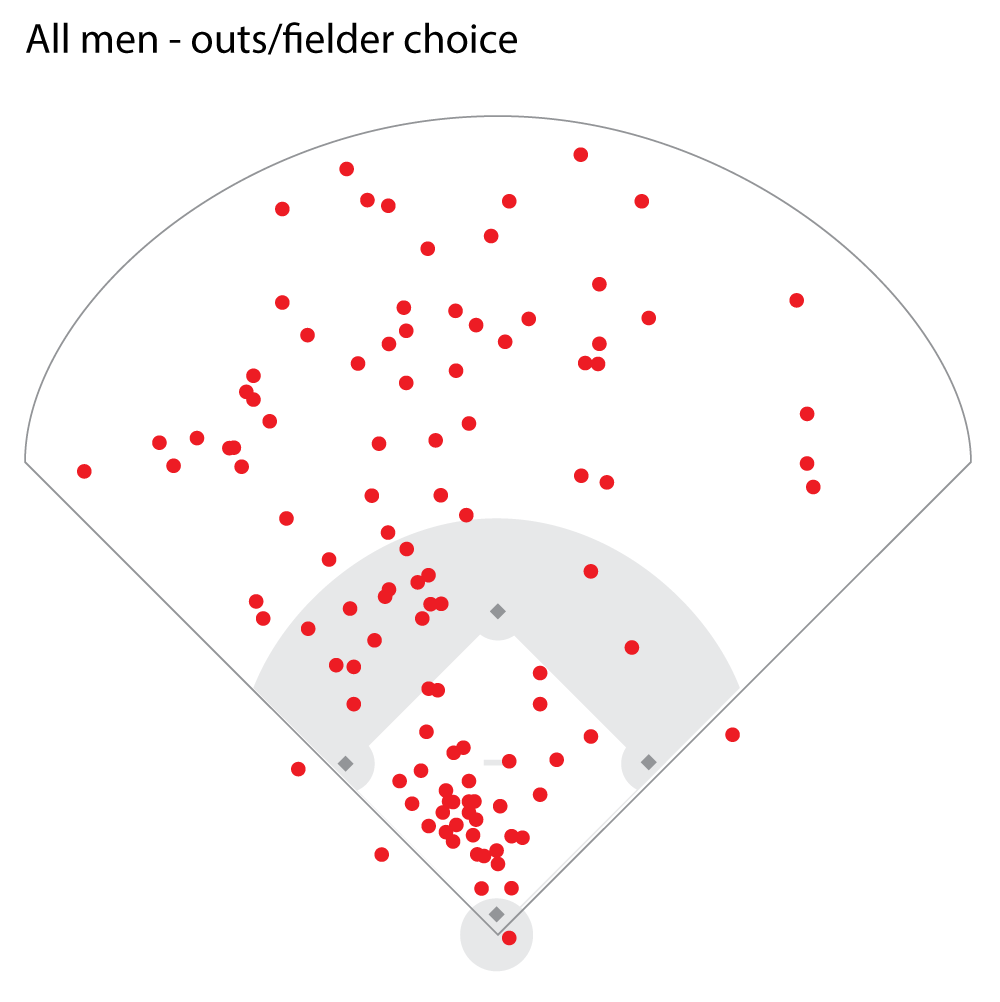
- Total men hits = 308
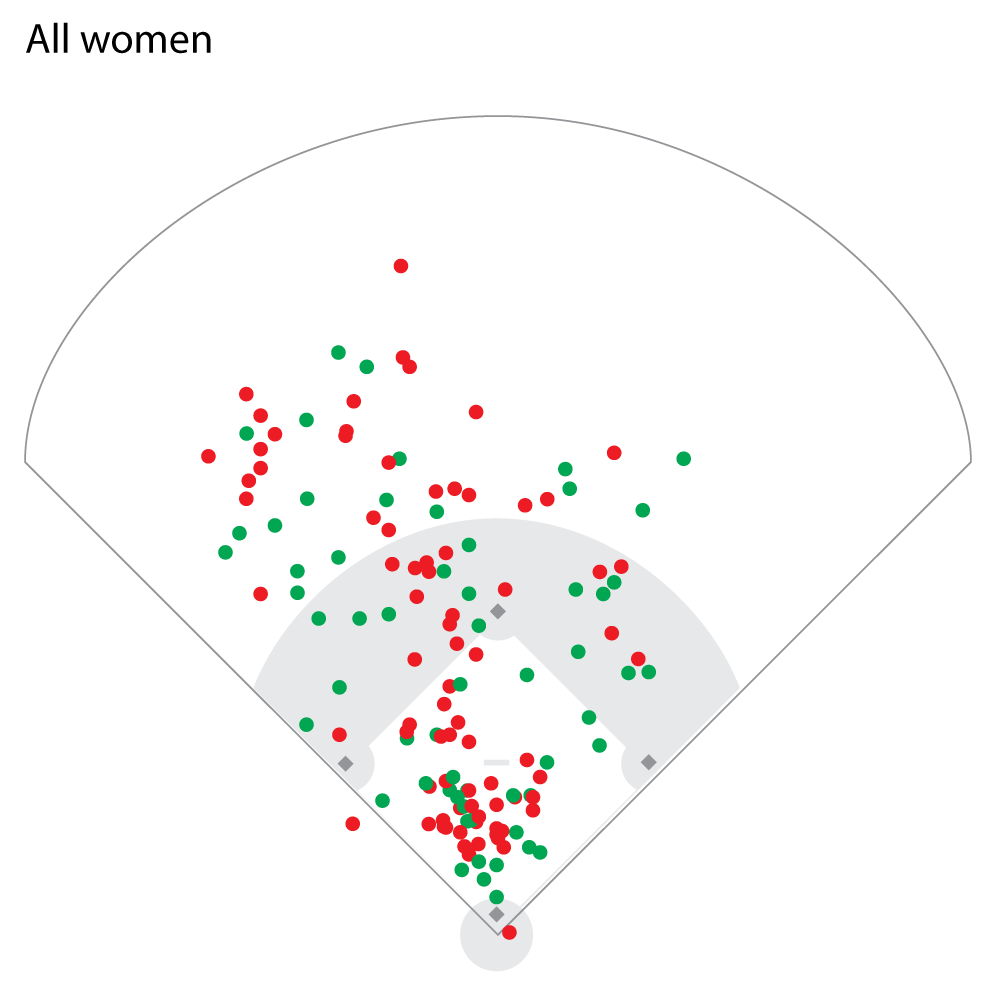
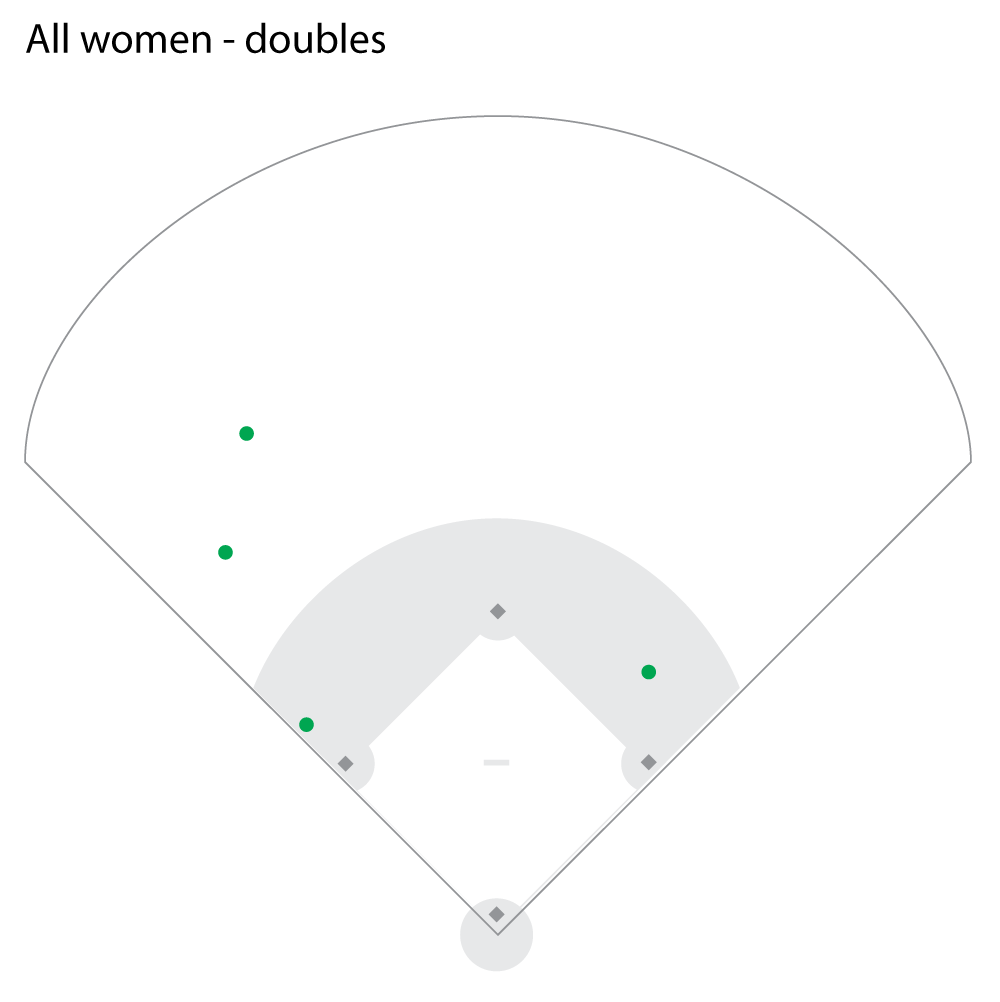
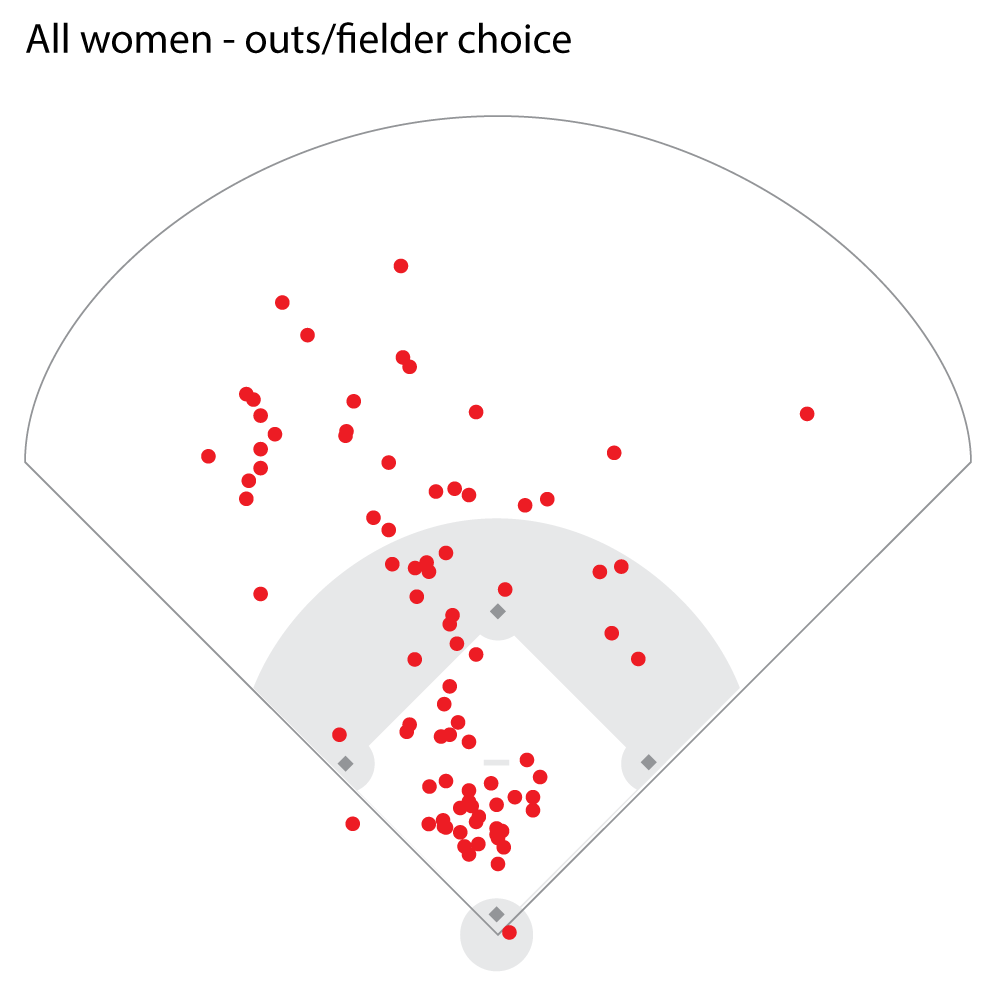
- Total women hits = 98
- Green = single, double, triple, or home run
- Red = out or fielder choice
Notes
- Dots are where the ball landed. The graphs do not represent speed or rolling distance, just where the ball made initial ground contact.
- Not enough data on lefties
- Not enough data on women’s triples or home runs
- This data has been pulled from Tuesdays at Comstock, Thursdays at Comstock, and Fridays at Howarth. They’re all bottom-level leagues but that’s why I have more data on men than women.